I invite people into data use.
Evaluation has a reputation problem.
It’s often imagined as a stack of reports, a dashboard no one logs into, or a requirement met and then politely ignored. Worse, evaluation is sometimes experienced as a verdict: success or failure, pass or fail, good or bad.
When evaluation feels like judgment, people understandably get cautious. Defensive. Quiet.
But when collaborators work with care and intention, evaluation can project possibility. Attract attention. Spark questions. Evaluation can bring people into the room.
That’s when evaluation stops being a checkbox and starts being an invitation.
“That’s the ticket.”
One of the central ideas I return to in my work is simple but powerful: data does not use itself. The benefits of evaluation show up not just because numbers were collected, but because people were invited into the process early and often. When practitioners build an audience for data use, evaluation becomes less about compliance and more about connection.
A couple of years ago, the National Sexual Violence Resource Center (NSVRC) partnered with SMW Consulting, LLC to assess prevention evaluation capacity across all 50 states and five U.S. territories. The NSVRC National Strengths and Needs Assessment compared what prevention leaders and practitioners reported in a baseline survey in 2021 with what they reported again in 2024, after three years of national training and technical assistance provided by NSVRC with funding from the US Centers for Disease Control and Prevention.
The results were striking. Prevention leaders reported statistically significant increases across every measured benefit of evaluation.
Not just better reports, but better relationships.
Not just clearer findings, but greater momentum.
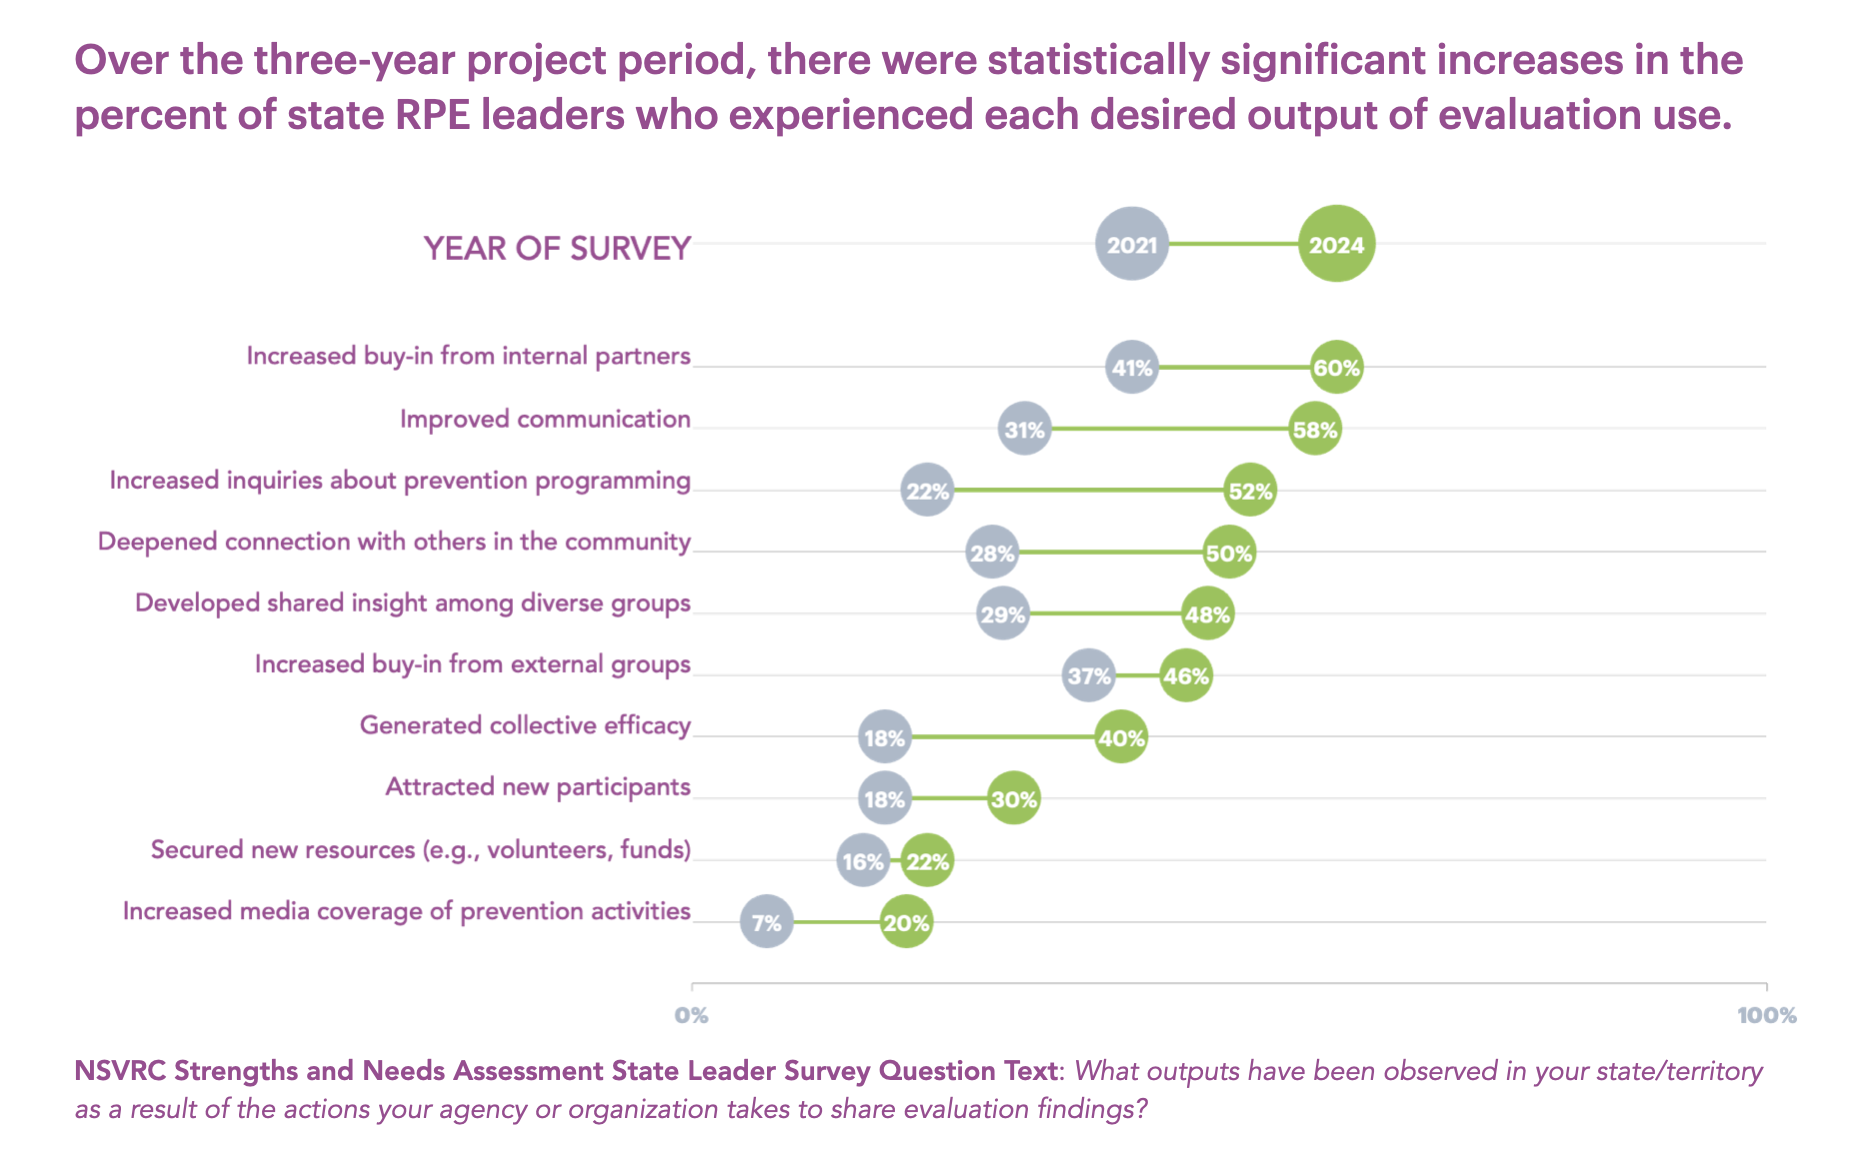
A dot plot graph is displayed illustrating a pattern of improvement from 2021 (gray dots) to 2024 (green dots) on ten outputs of evaluation use. The range of values represented by the gray dots, which indicate % of leaders who experienced the benefit in 2021 is low of 7% to high of 41%. The range of values represented by the green dots is low of 20% and high of 60%,
Interpretation tips:
The survey question presented all options shown above using a “check all that apply” option, so that each option was marked: YES, NO, or I don't know.
The grey dot on the left represents the percentage of 49 state leaders who in 2021 checked YES, they had observed that benefit in their state or territory.
The green dot on the right represents the percentage of 42 state leaders who in 2024 checked YES, they had observed the benefit in their state or territory.
The length of the bar connecting the two dots indicates the amount of change, such that longer bars indicate more change.
The benefits of evaluation use are listed to suggest summative findings — with most endorsed benefit at the project end (2024) at the top of the list and least endorsed benefit in 2024 at the bottom.
One result I especially love is this: increased inquiries about prevention programming. That single outcome tells a bigger story. When people ask more questions about prevention, it means the work is visible. It means others see value. It means evaluation has helped turn practice into something people want to engage with, not avoid.
This is where building an audience for data use really comes alive.
Data doesn’t create change on its own. People do. Evaluation becomes powerful when practitioners know how to share what they’re learning, when funders and partners understand what the data is saying, and when communities start asking informed questions. Training and technical assistance helped bridge that gap, turning evaluation into a shared space rather than a private exercise.
Here’s overview of the assessment finding and what it points toward:
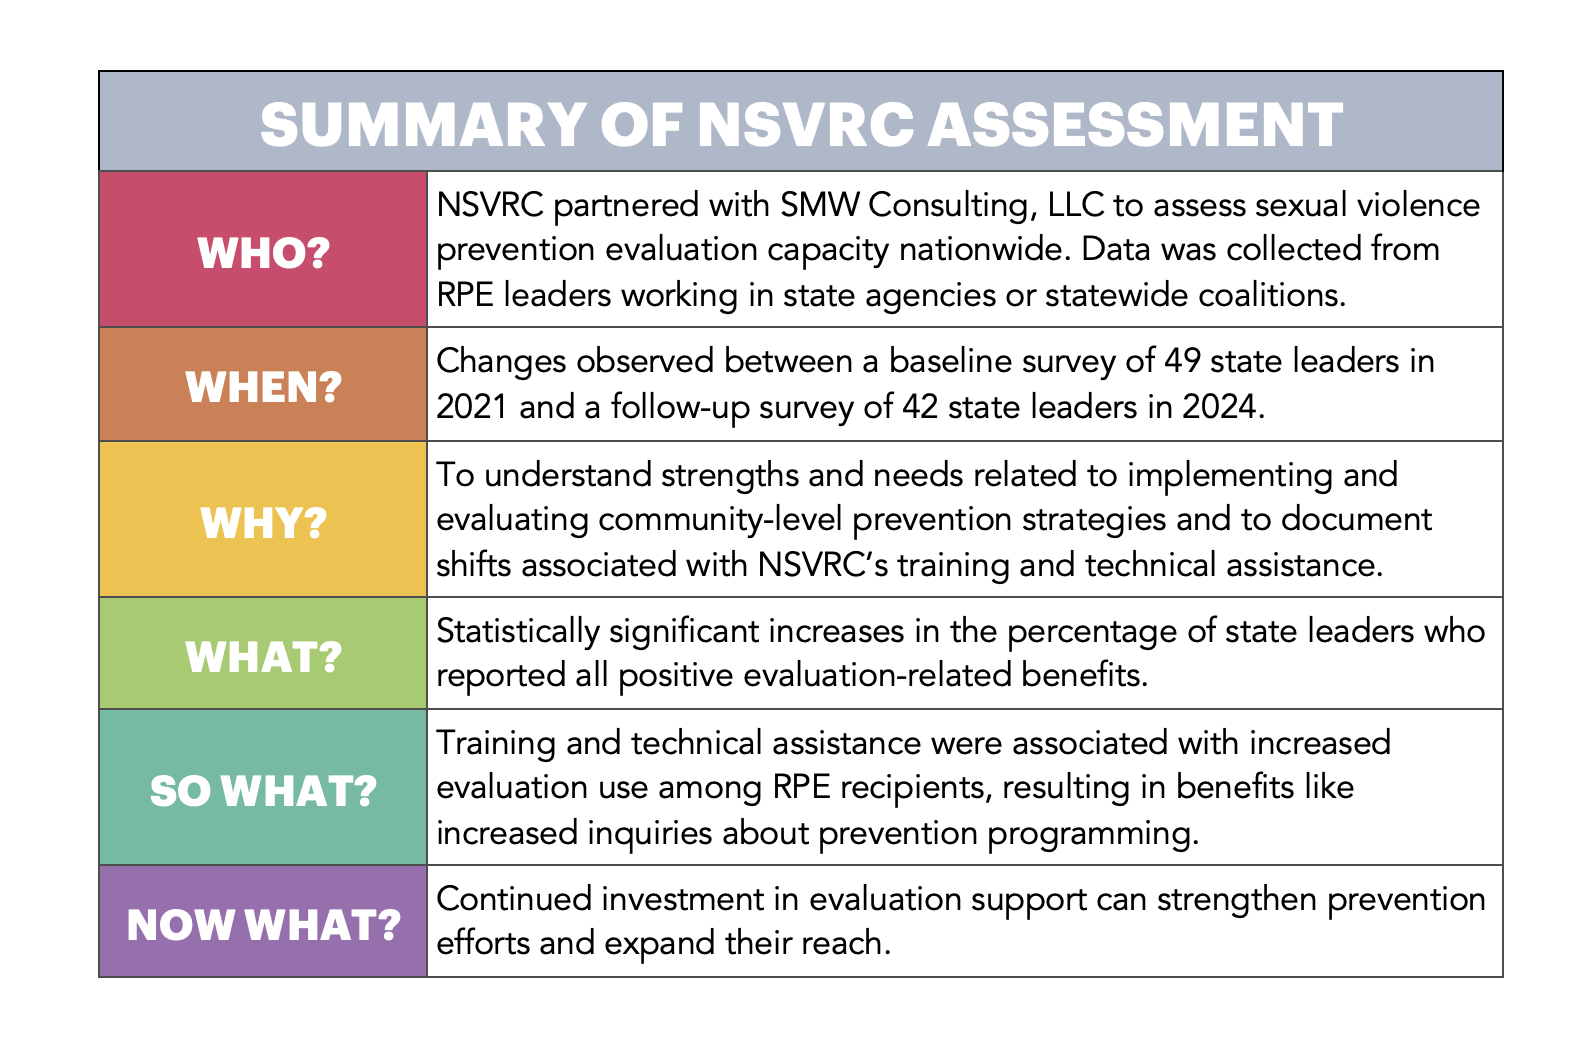
There is a table full of text above organized into six rows and two columns the first column contains the questions: who? when? why? what? so what? now what? and the second column contains detailed answers.
These findings echo what many practitioners sense intuitively: evaluation is not just about measuring outcomes. It’s about storytelling. It’s about helping people see themselves in the work and understand how their contributions matter.
When data is shared thoughtfully, it builds buy-in, deepens connections, attracts new partners, and sometimes even opens doors to new resources. It helps prevention efforts feel less isolated and more collective.
If you’re part of a sexual violence prevention program, NSVRC offers extensive resources for advocates and educators. And if you’re curious about working more closely together, you can reach me by emailing sharon@smwconsultingllc.com or by finding me on LinkedIn.
Because when data finds its audience, prevention and intervention also get a foot in the door.


