

I love data.
I'm not the only one.
I did not declare my major in psychology until I was a junior. Key to my decision was the revelation that psychology was not just "helping people," it was SCIENCE. I was intrigued by the clever research designs I learned about in my Psychology and the Law class, and comforted by the scientific process that followed a research question -- some variation on "why do people do the things they do?" -- to its evidence-based conclusion.
A work-study job at the Personality, Motivation & Cognition lab seduced me with the double-blind assignment of consenting Psych 100 students to treatment or control conditions, playing the role of experimenter, scoring subjects' personality inventories, and tracking data from survey to single-line (CSV) entry on an early 90's Mac. I was entertained by faculty and grad students' unabashed excitement with, for example, the interaction effect of diurnal rhythms and caffeine consumption on math performance. They were really fired up. During lab meetings, they would at times jump up, and run over to the chalkboard to draw a graph. I filed it away: these lab people have some intense love for data.
Fast forward to graduate school where my dissertation advisor was also the multivariate statistics instructor. Prior to taking her course, she told me that I was about to experience what would probably be the steepest learning curve of my life (neither of us had kids yet), but that mastering multivariate data analysis would open doors to answering the kinds of scientific questions I cared about. This was when I, too, became one of the data-loving people. Becki Campbell brought me into friendship with data by saying things like, "what's the story these data are telling us?" and "what do you want to be able to ask your data?" It wasn't long before I was leaping up, scratching out the definitional formula for variance, and drawing sampling distributions on the chalkboard while insisting to my own undergraduate stats students, "now watch -- this part is really, really cool."
When I made the transition from academia to consulting in 2011, I acquired a new appreciation for the power of data display from the data visualization community at the American Evaluation Association. I was completely gaga, scribbling love notes about fonts, color schemes, and dot plots while sitting in Stephanie Evergreen's talks. I quickly bought her book and all four of Edward Tufte's books, too. I found a new collaborator in my dad, who is a graphic designer. I was a regular visitor at Information is Beautiful. It is! When I need a LOL, I go directly to this collection. Gosh, I love that website so much.
Nathalie Miebach's work -- on temporary exhibit at the Akron Art Museum earlier this year -- had me falling in love all over again. I took some pictures of the brilliant ways she uses weather data to create, connect, and tell stories. For starters, she works in the intersection between art and science. So much to love already.
““Miebach’s sculptures have been likened to Tinker Toys. The artist values materials associated with play for facilitating her work across disciplines and for encouraging viewers to study complex data in ways that are not intimidating.””
She Cast Her Circles Wide, 2016. Rope, paper, reed, and data.
Description of Miebach's approach to her work posted at Intersections installation at Akron Art Museum October 1, 2016 through January 15, 2017.
One of my favorite things about Miebach's works is the way her use of playful materials "lures you in," as she says, to thinking about the staggering problem of climate change. This resonates with my appreciation of tangible tools for facilitating deeper understandings of, for example, the multidimensional nature of community readiness for change.
Credit where endless thanks are due: my colleague Sarah Kuhn pulled me into the realm of thinking with things. During our shared time as faculty associates at the UMass Lowell's Center for Women & Work, Sarah encouraged me to integrate Lego, collage, and other tactile objects into my work in the classroom and in the community, where I was attempting tough conversations about rape, collaboration, and justice.
It was a liberating moment in my career.
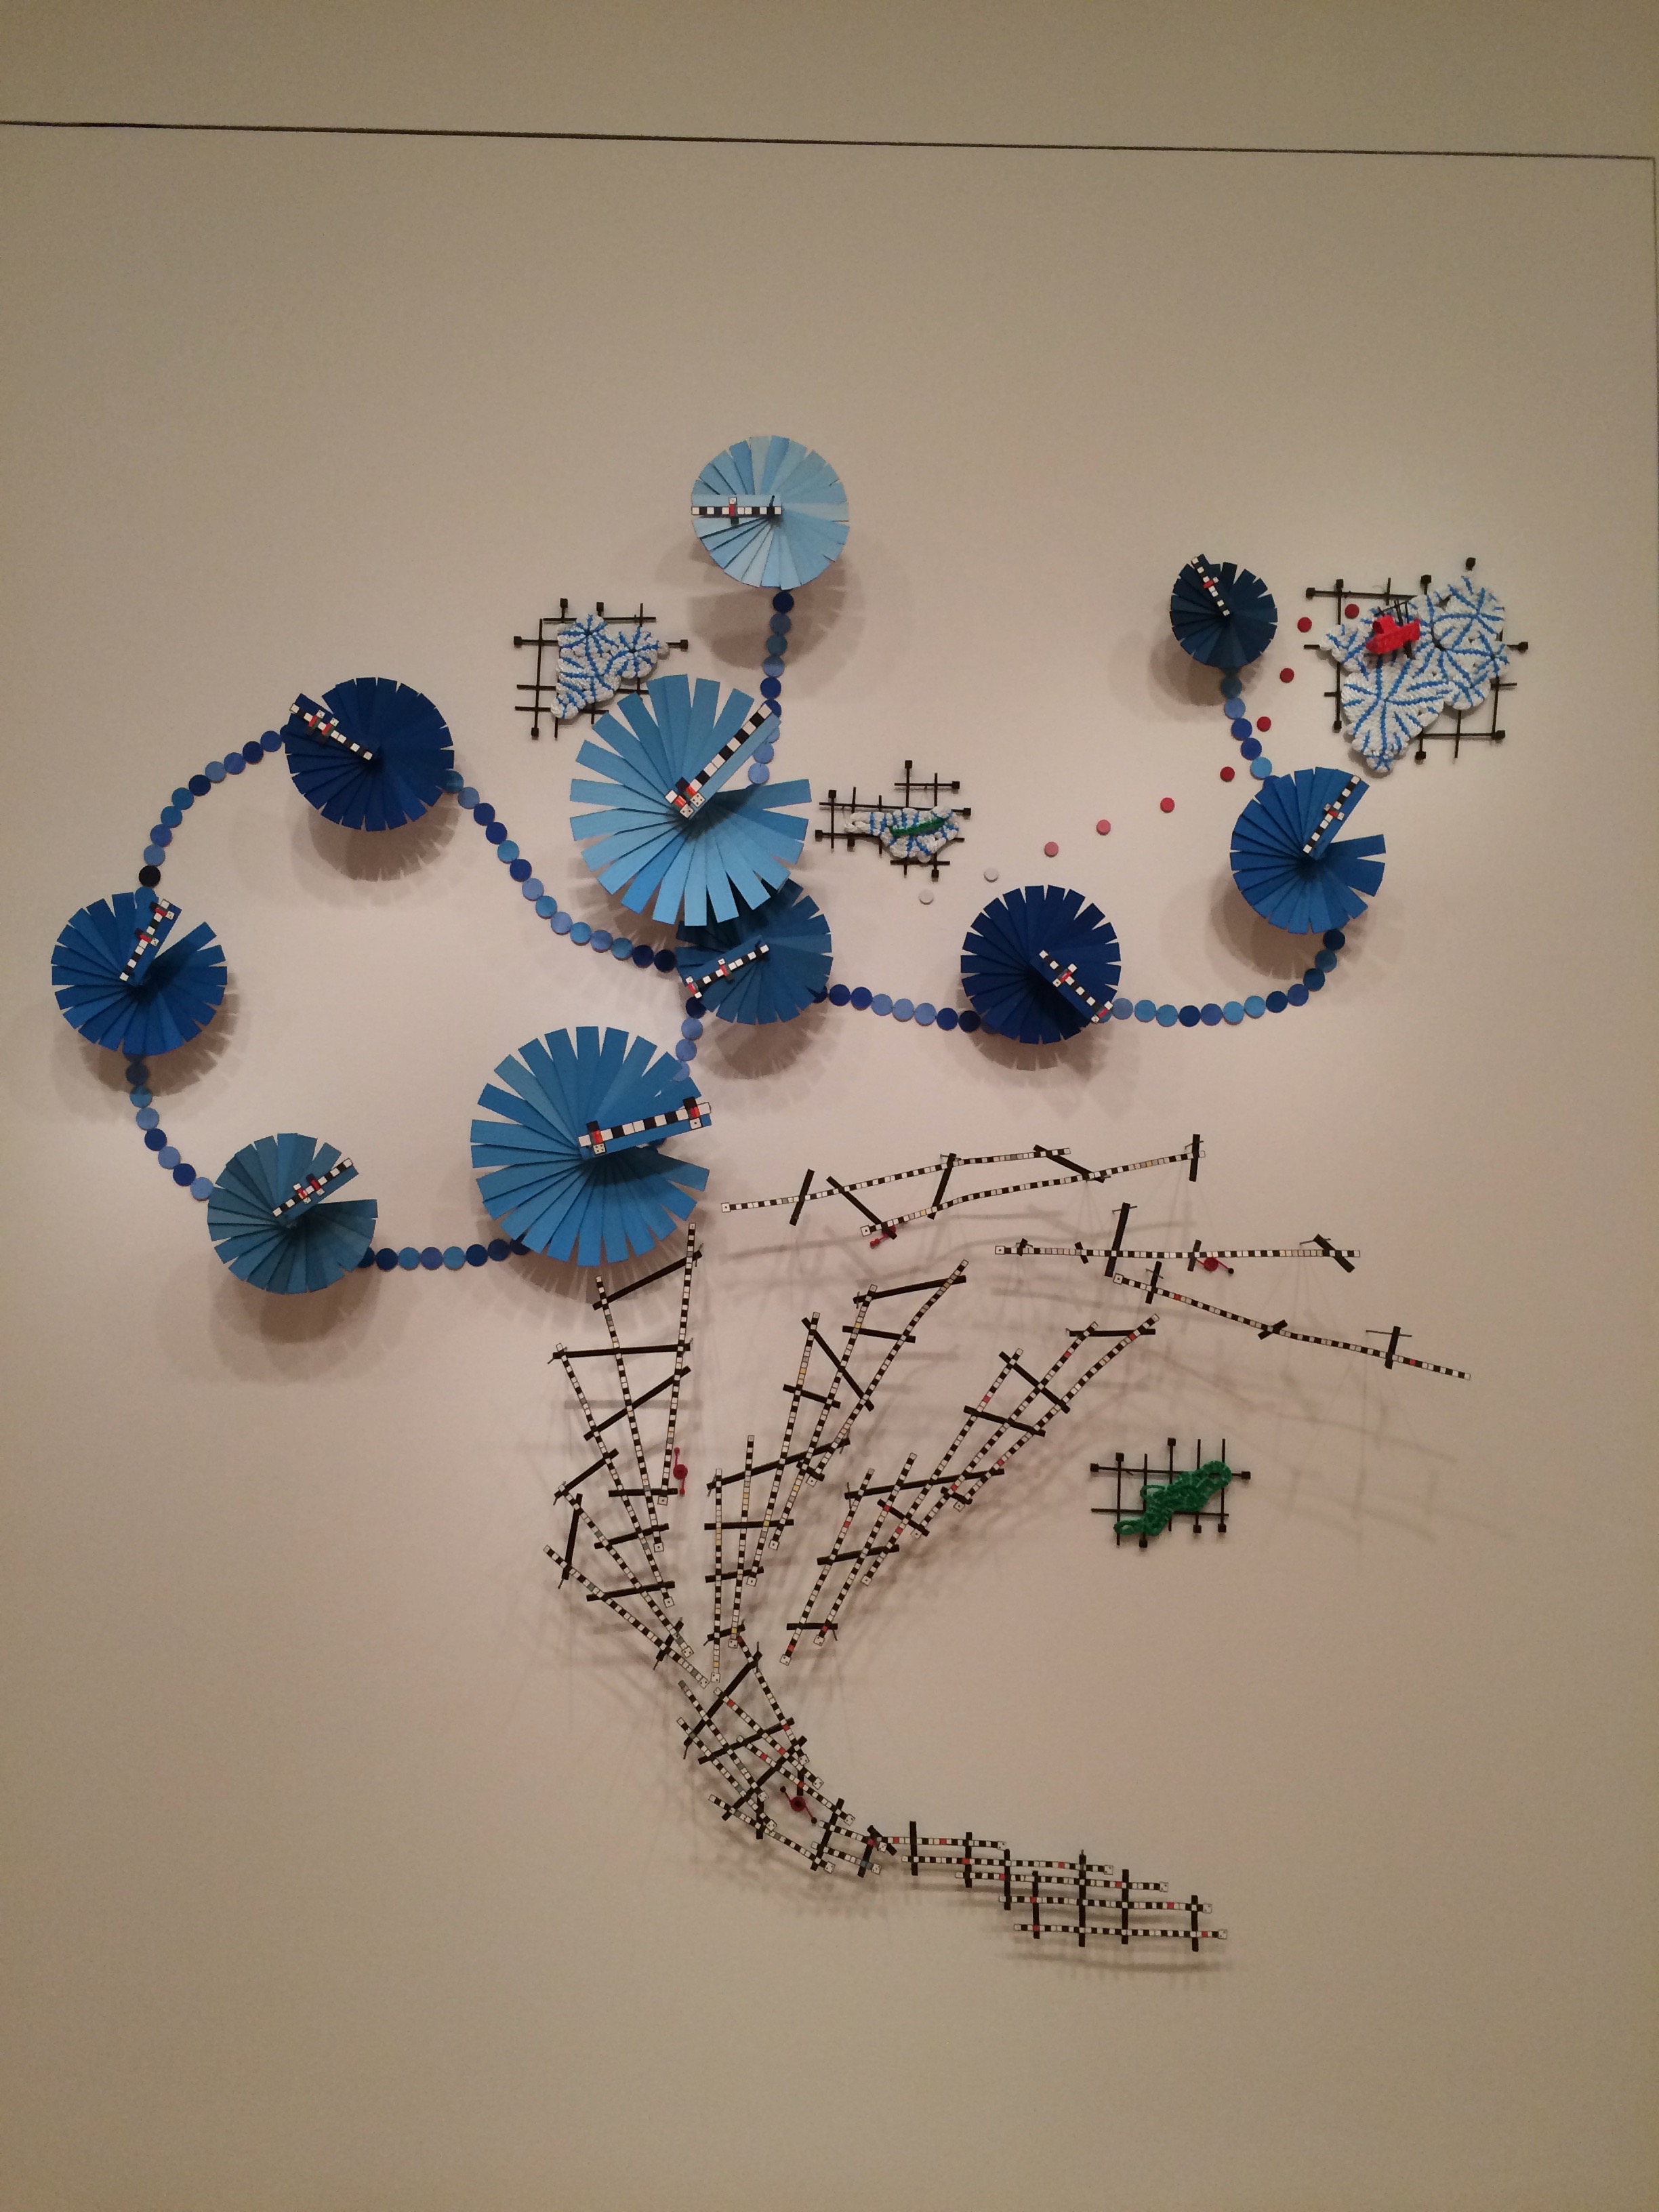
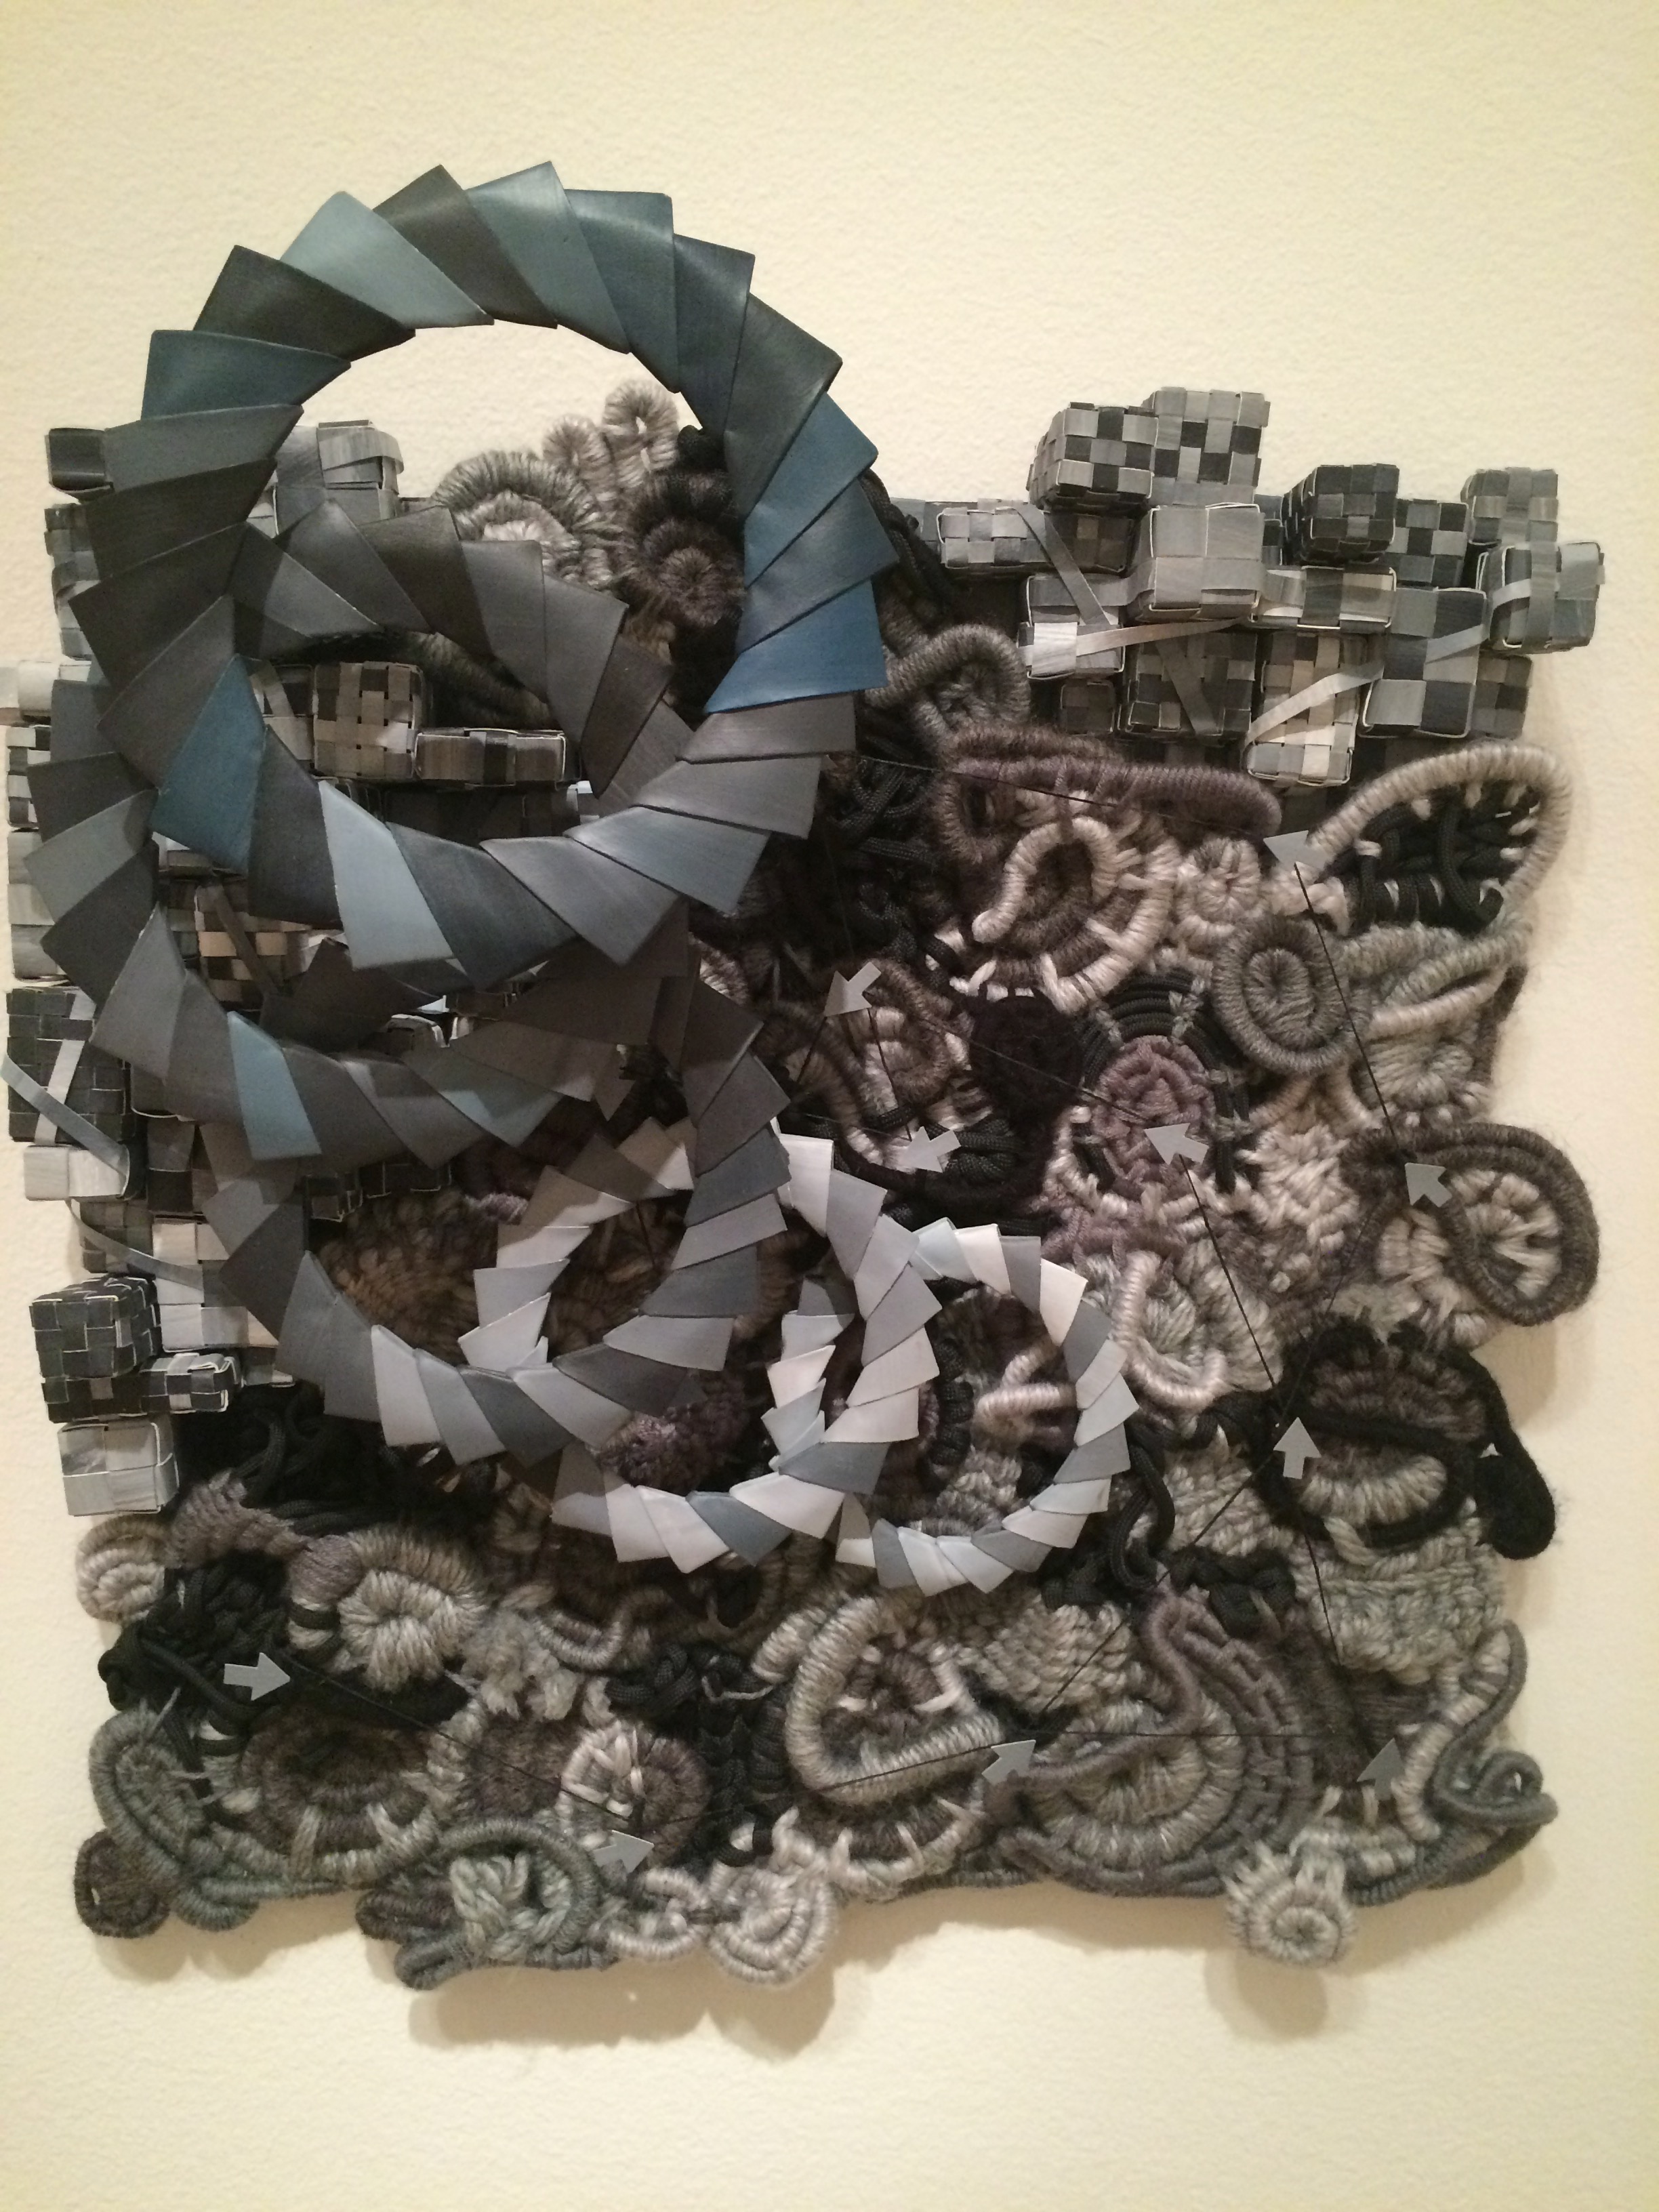
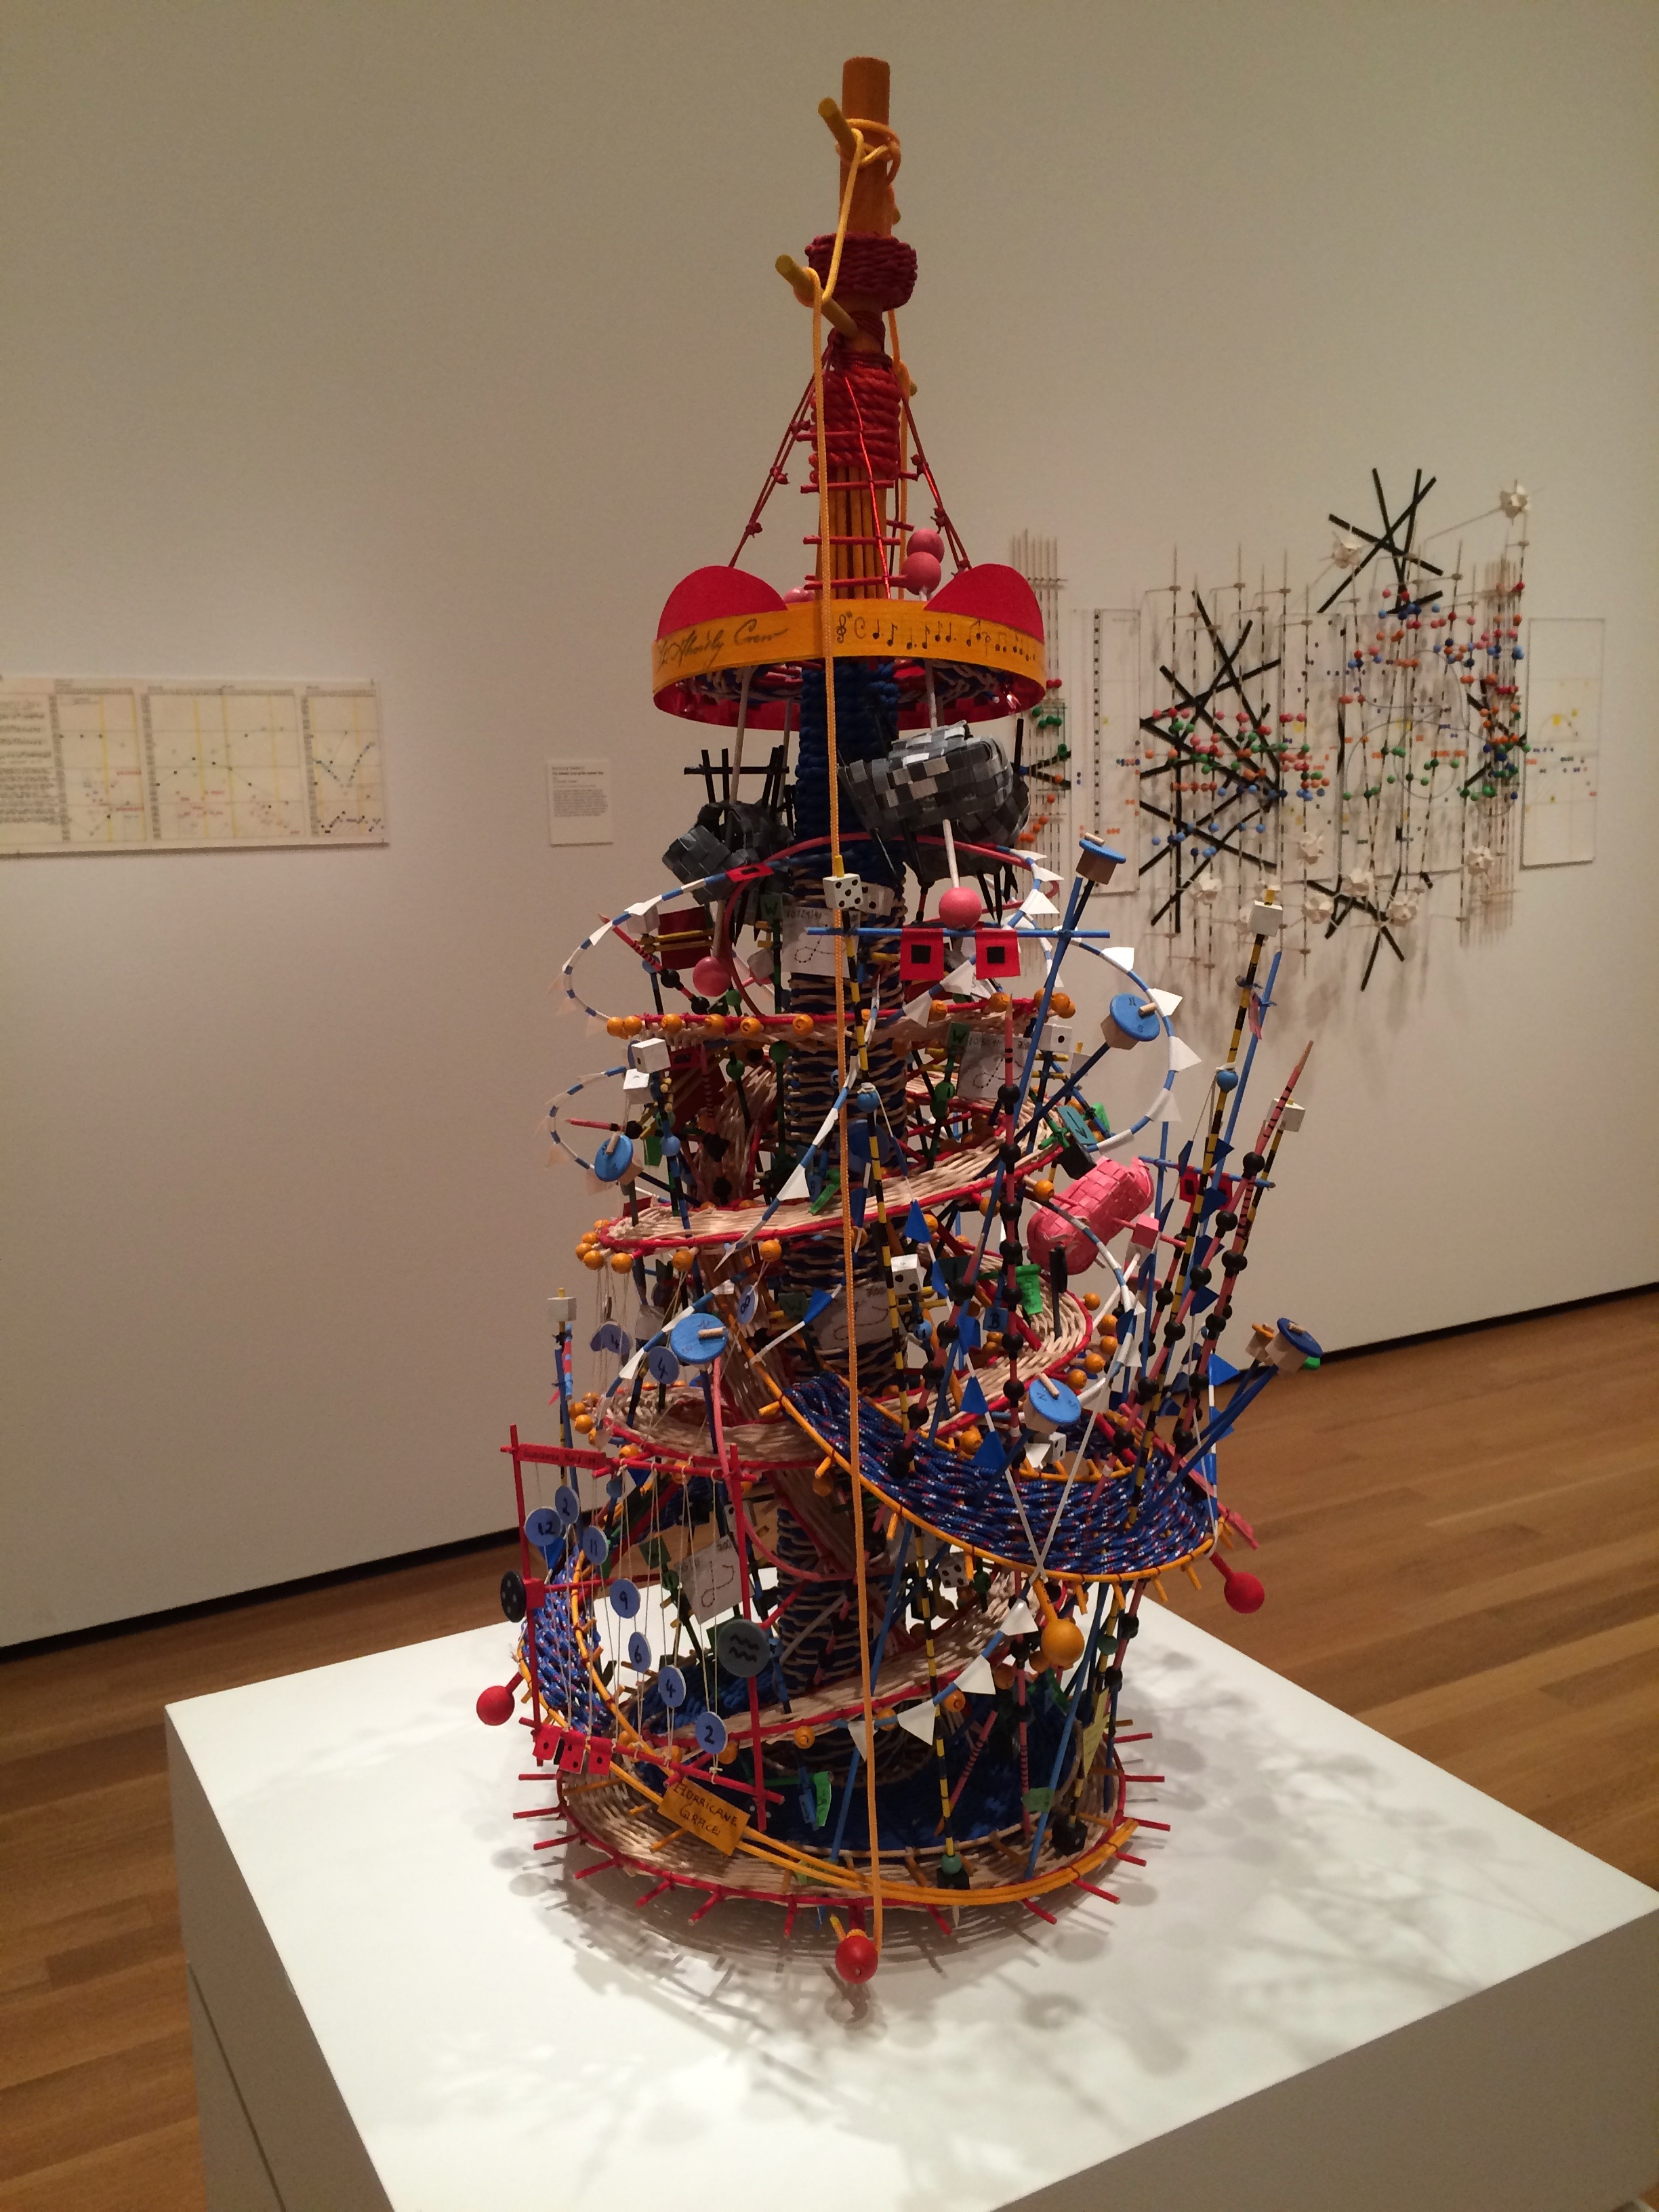
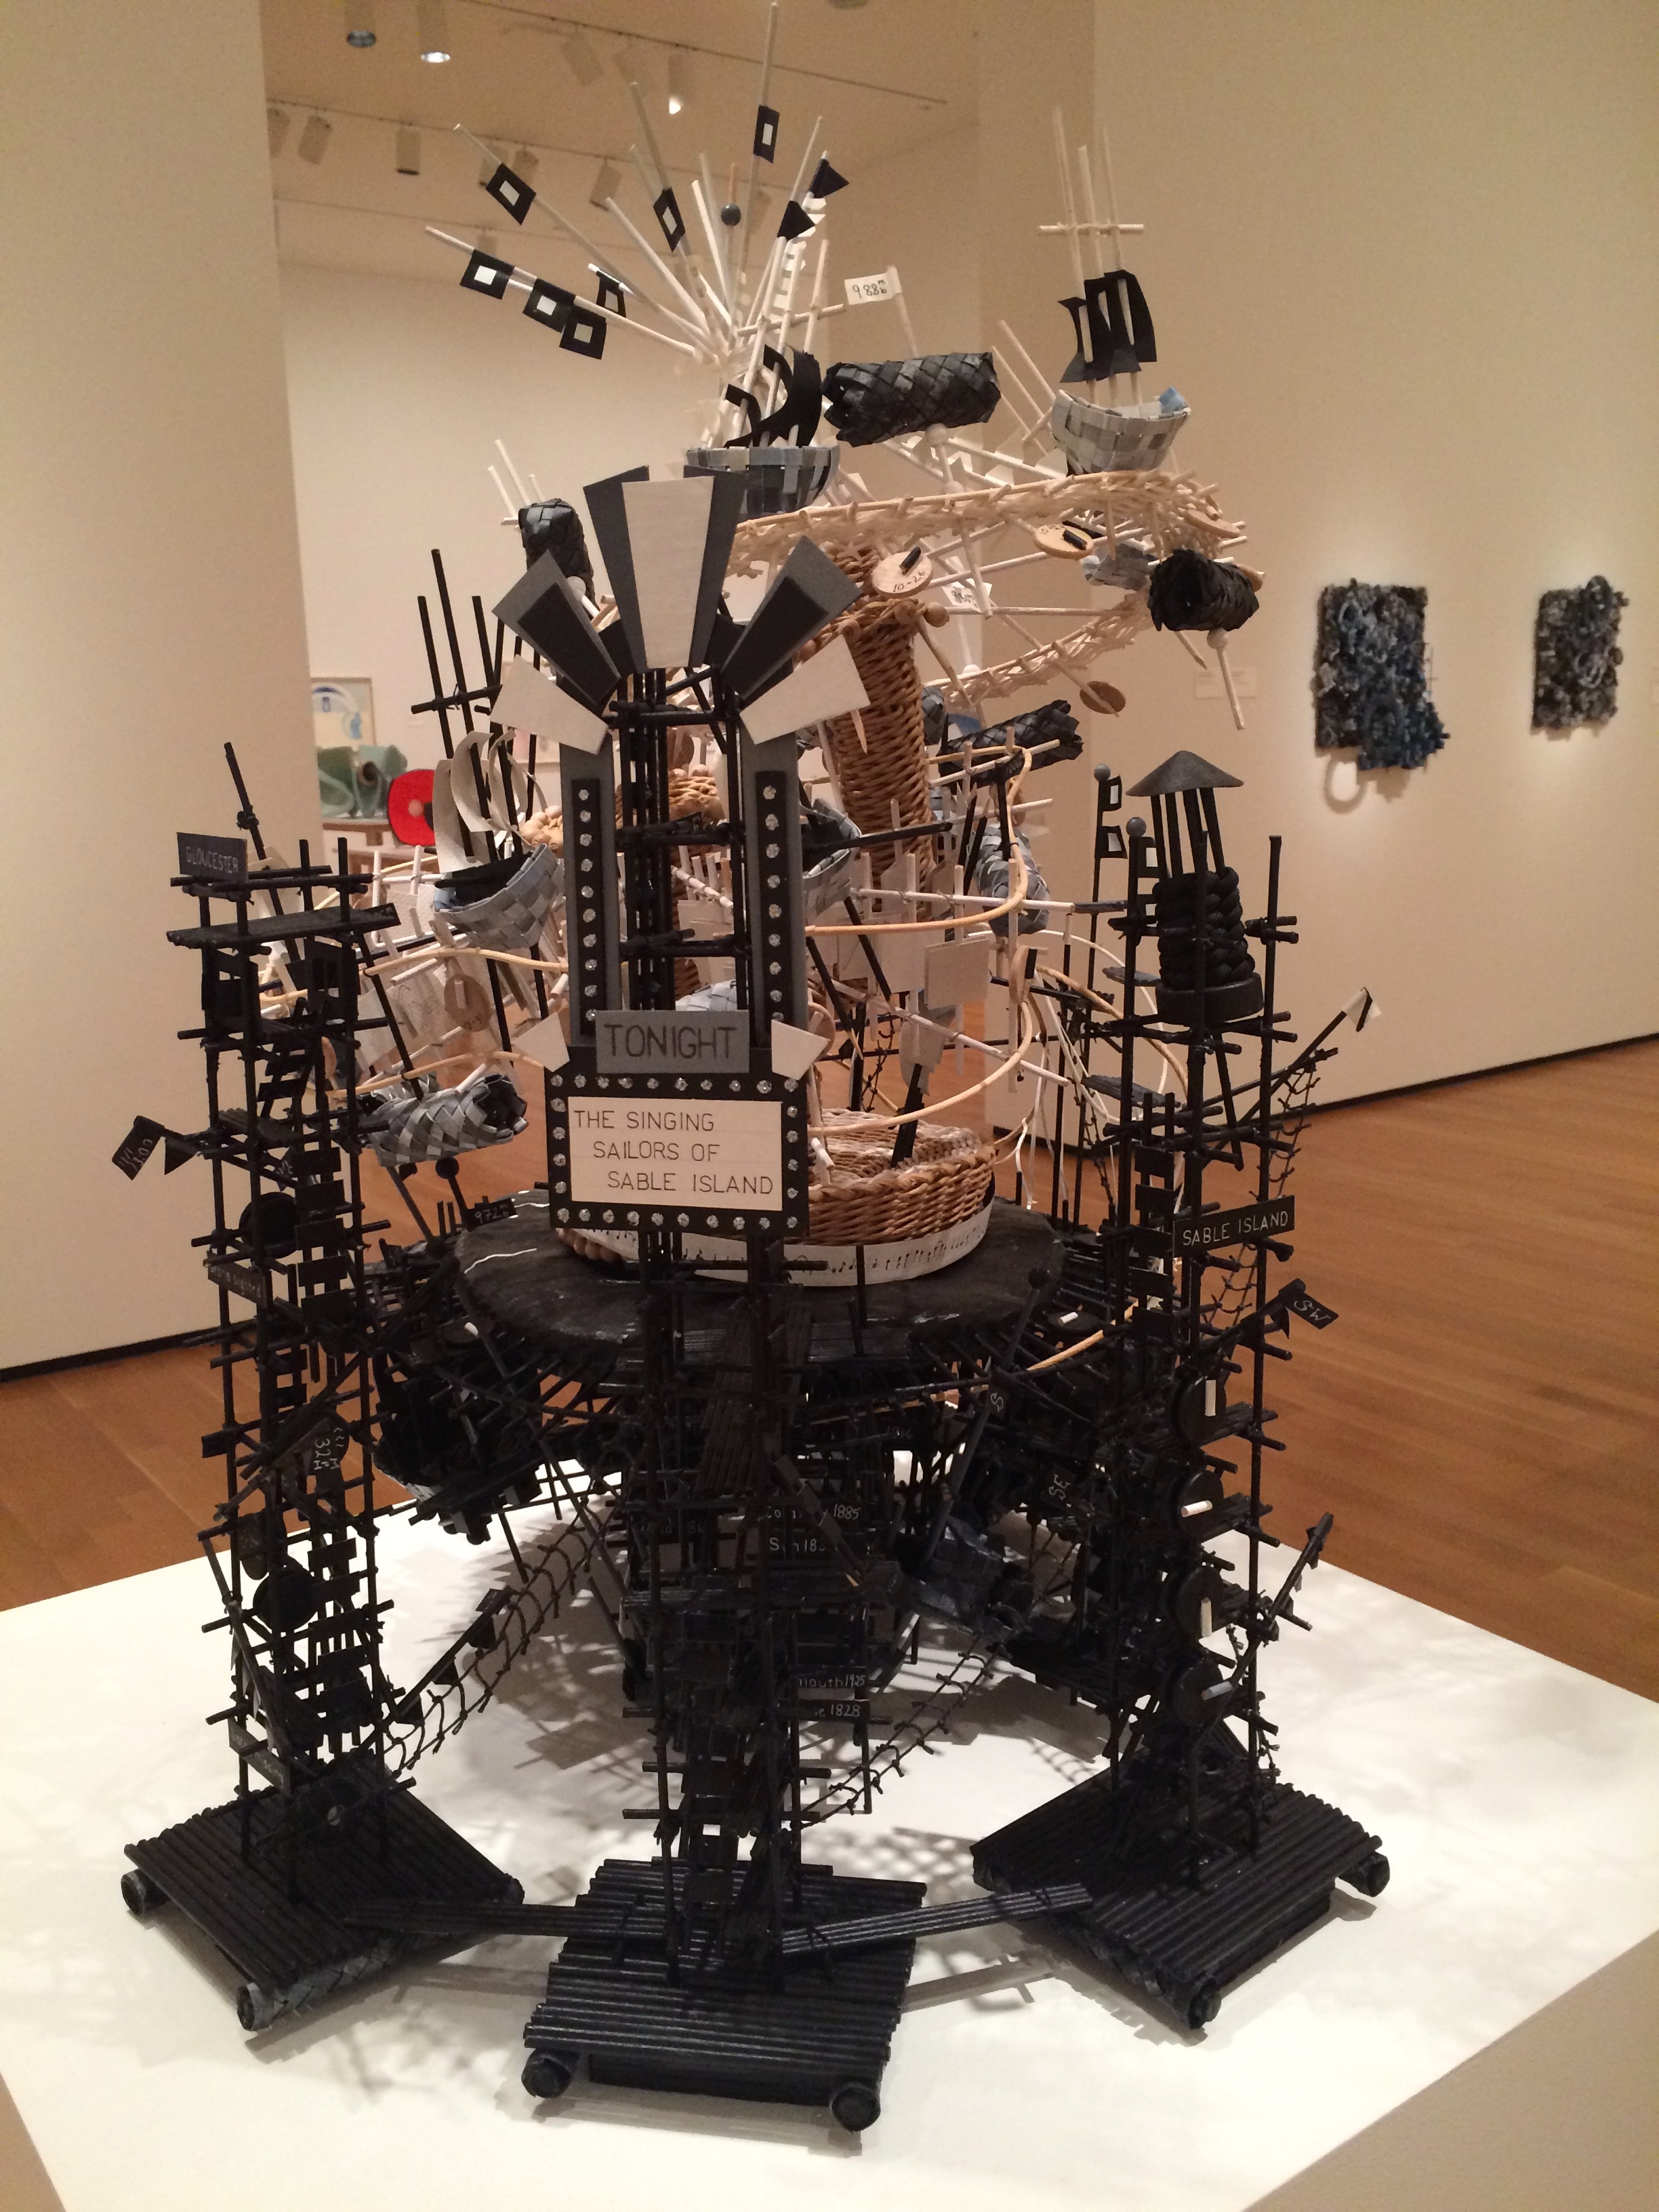
The images above are She's Coming On, She's Coming on Strong, 2011; Sandy's Track, 2015; To Captain Billy Tyne and His Crew, 2015; and The Singing Sailors of Sable Island, 2014.
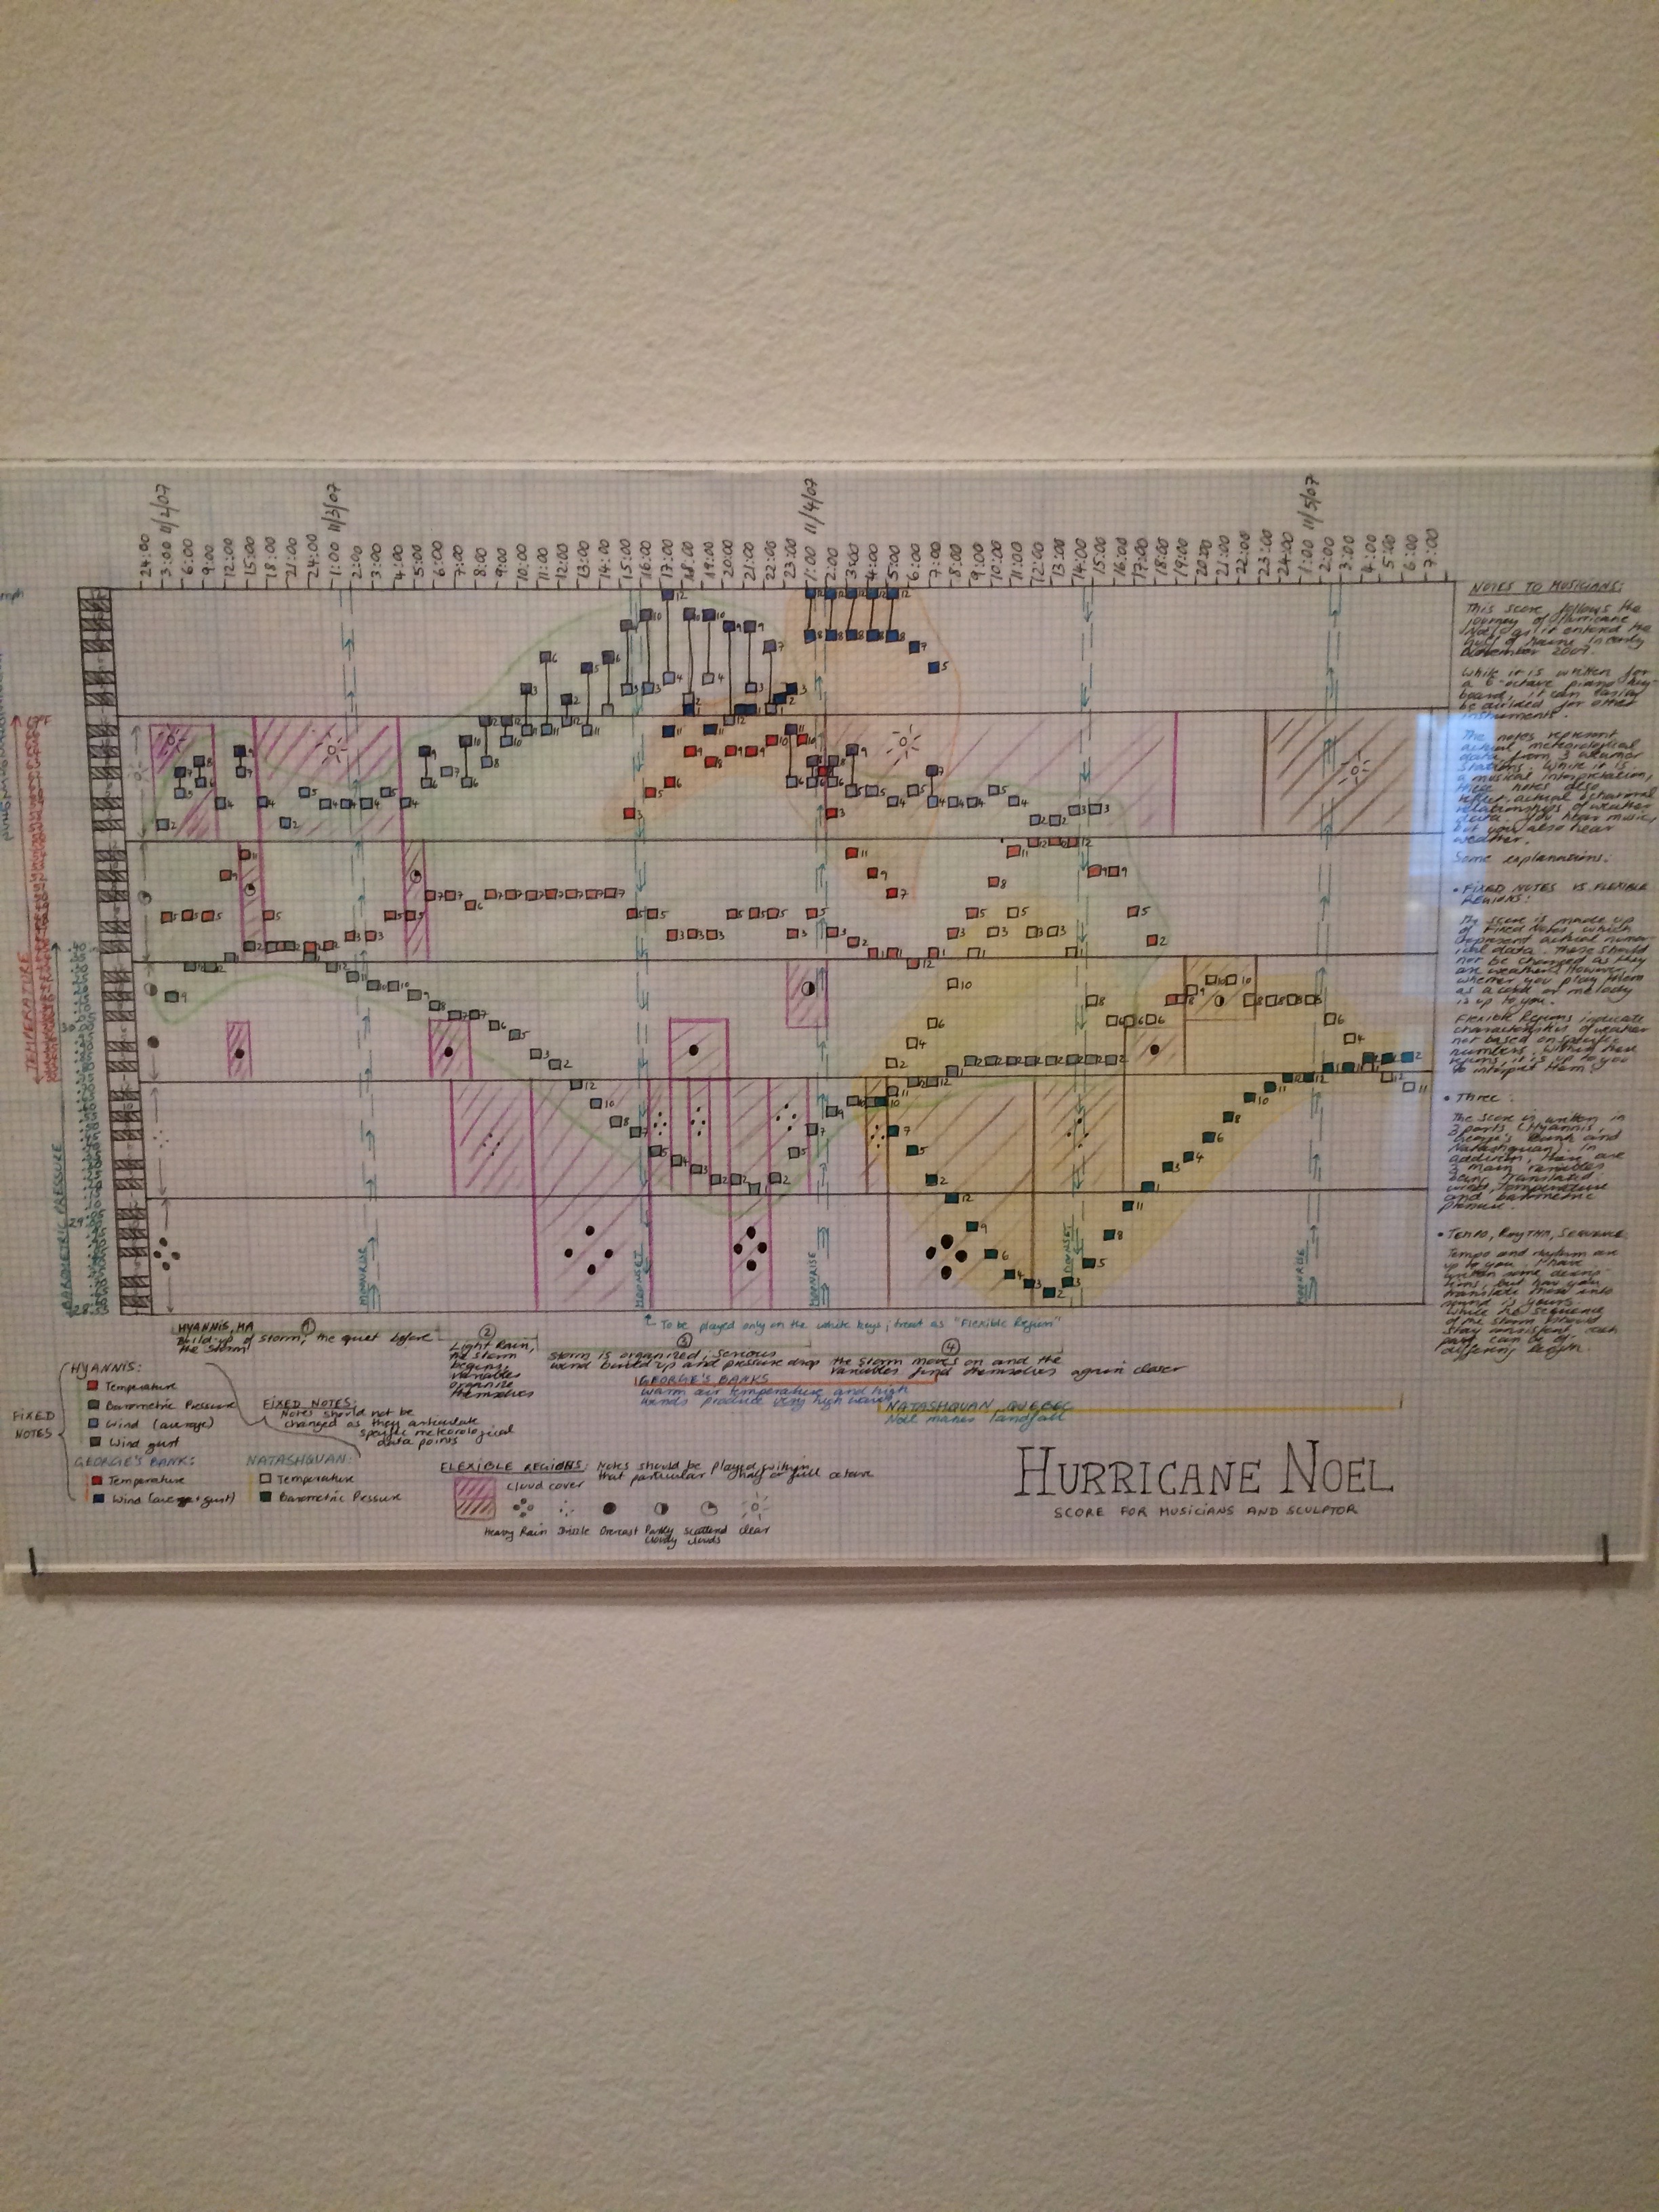
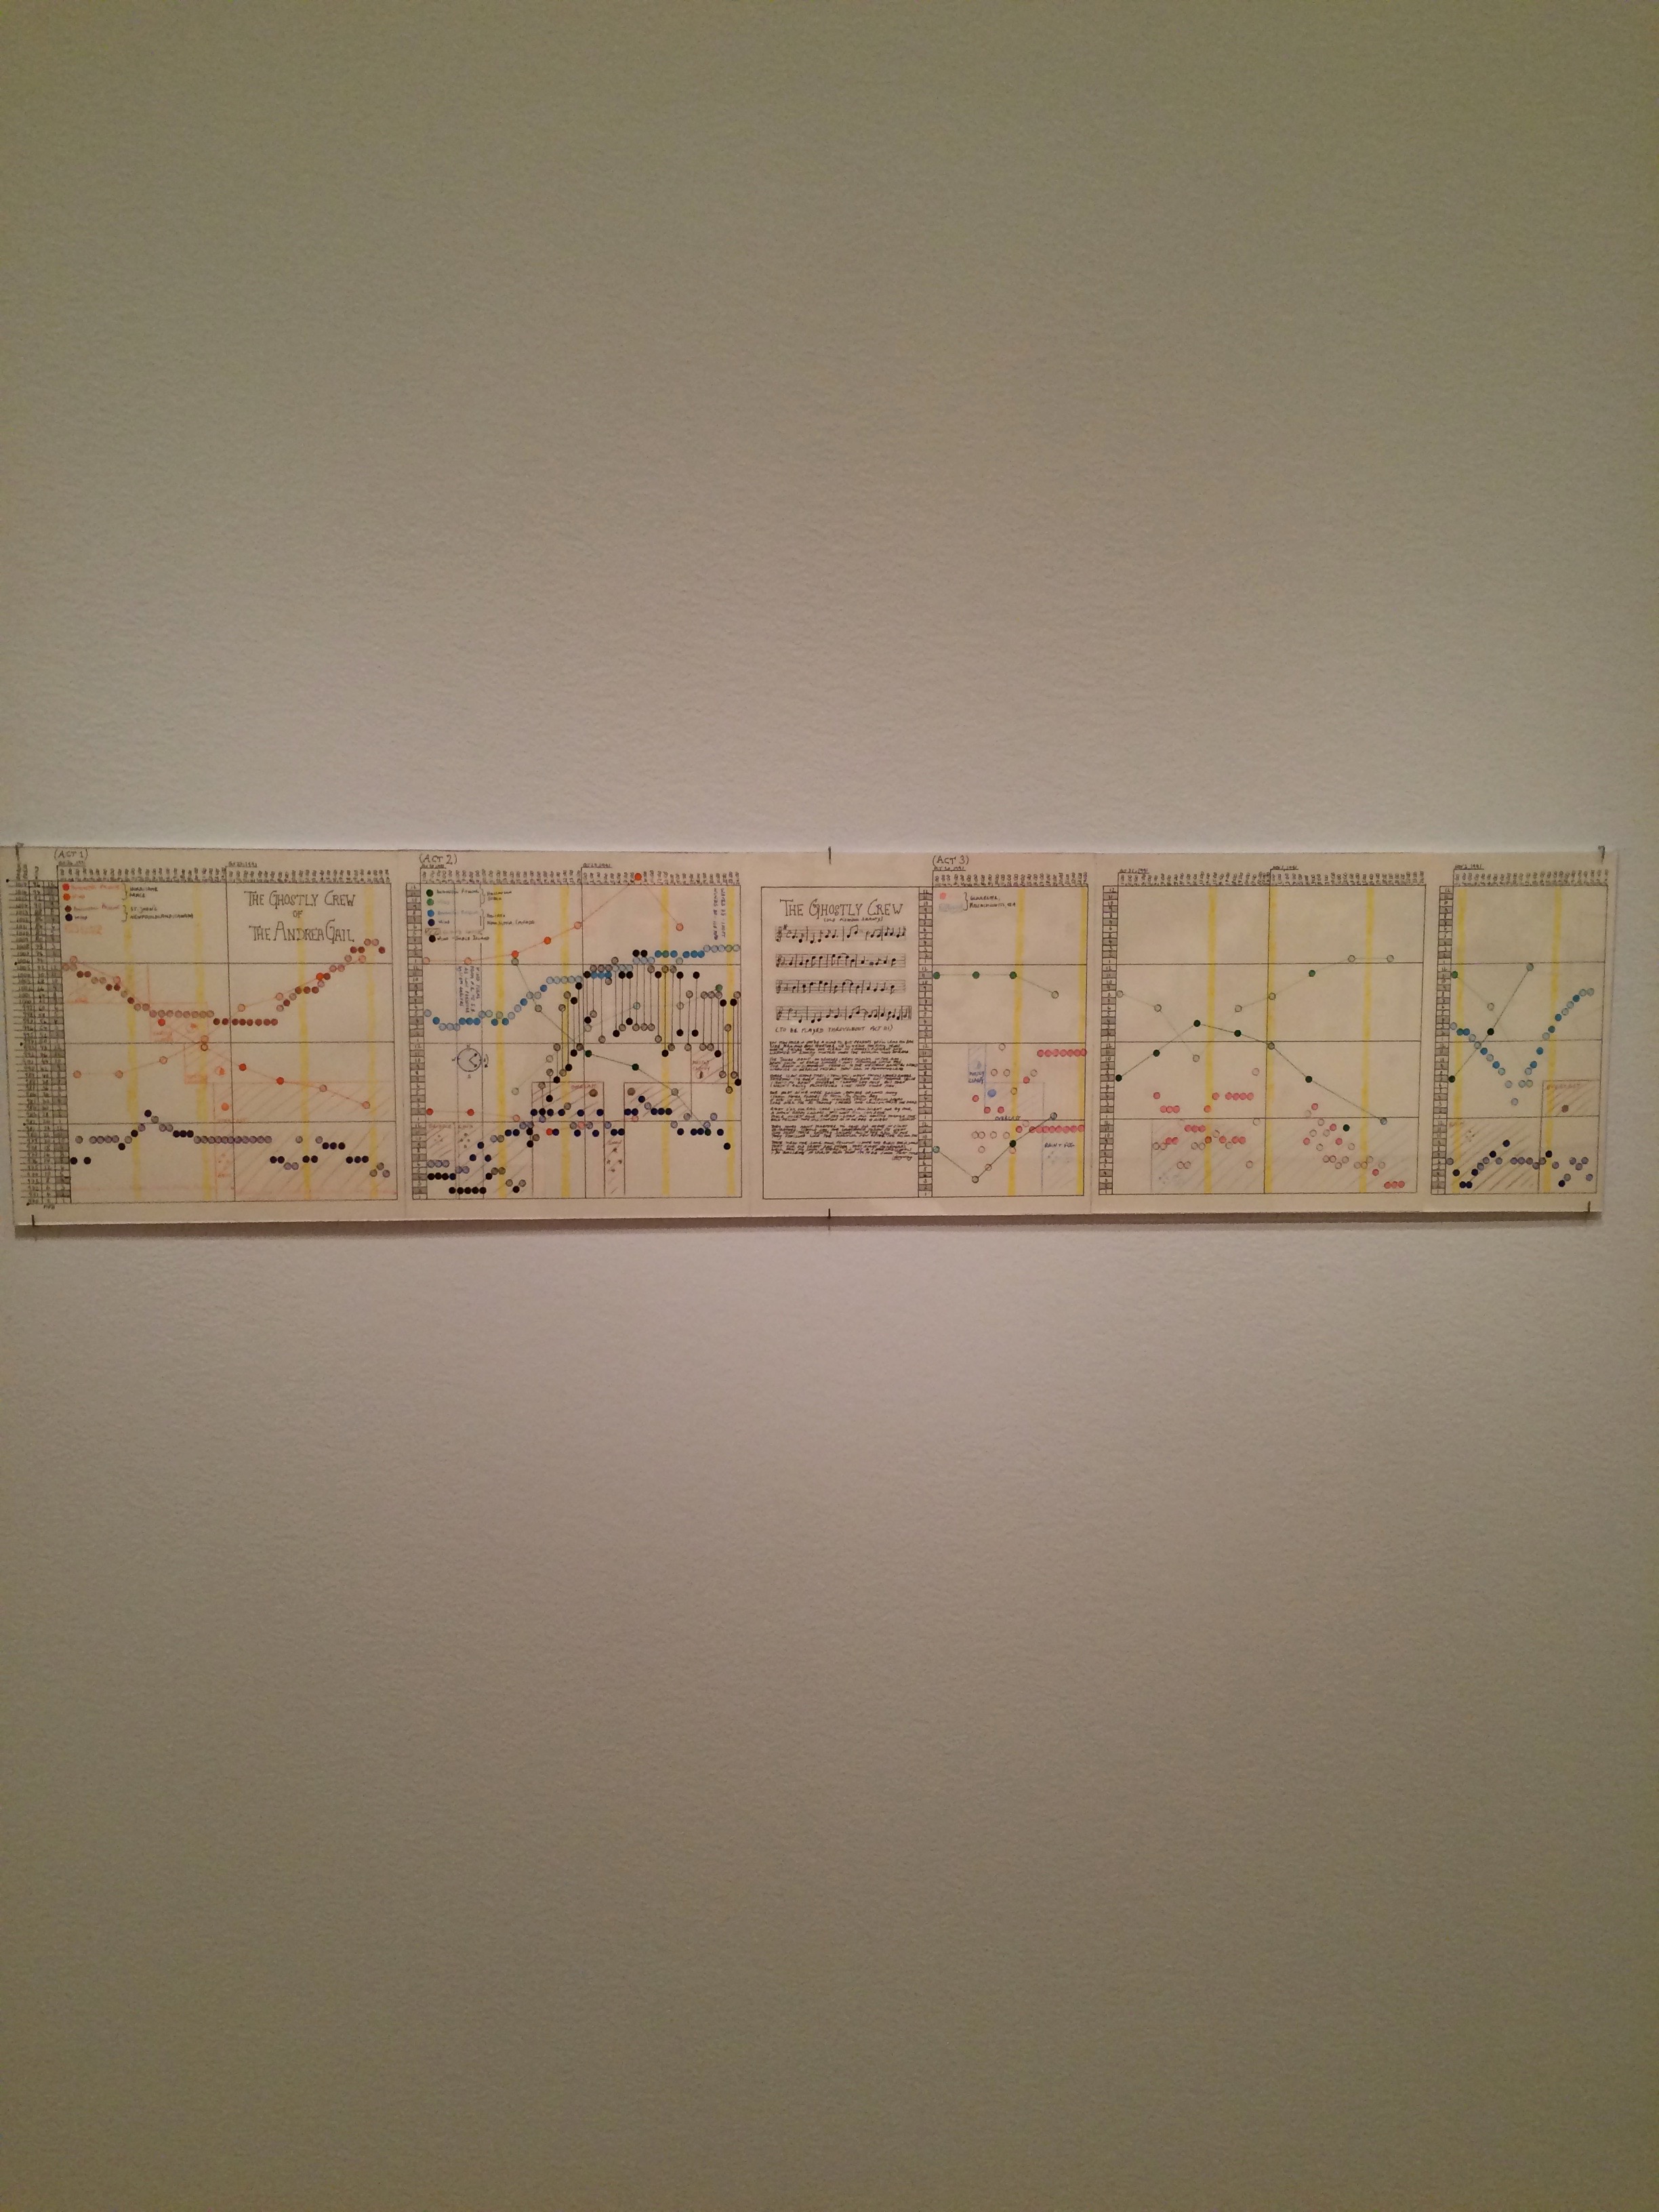
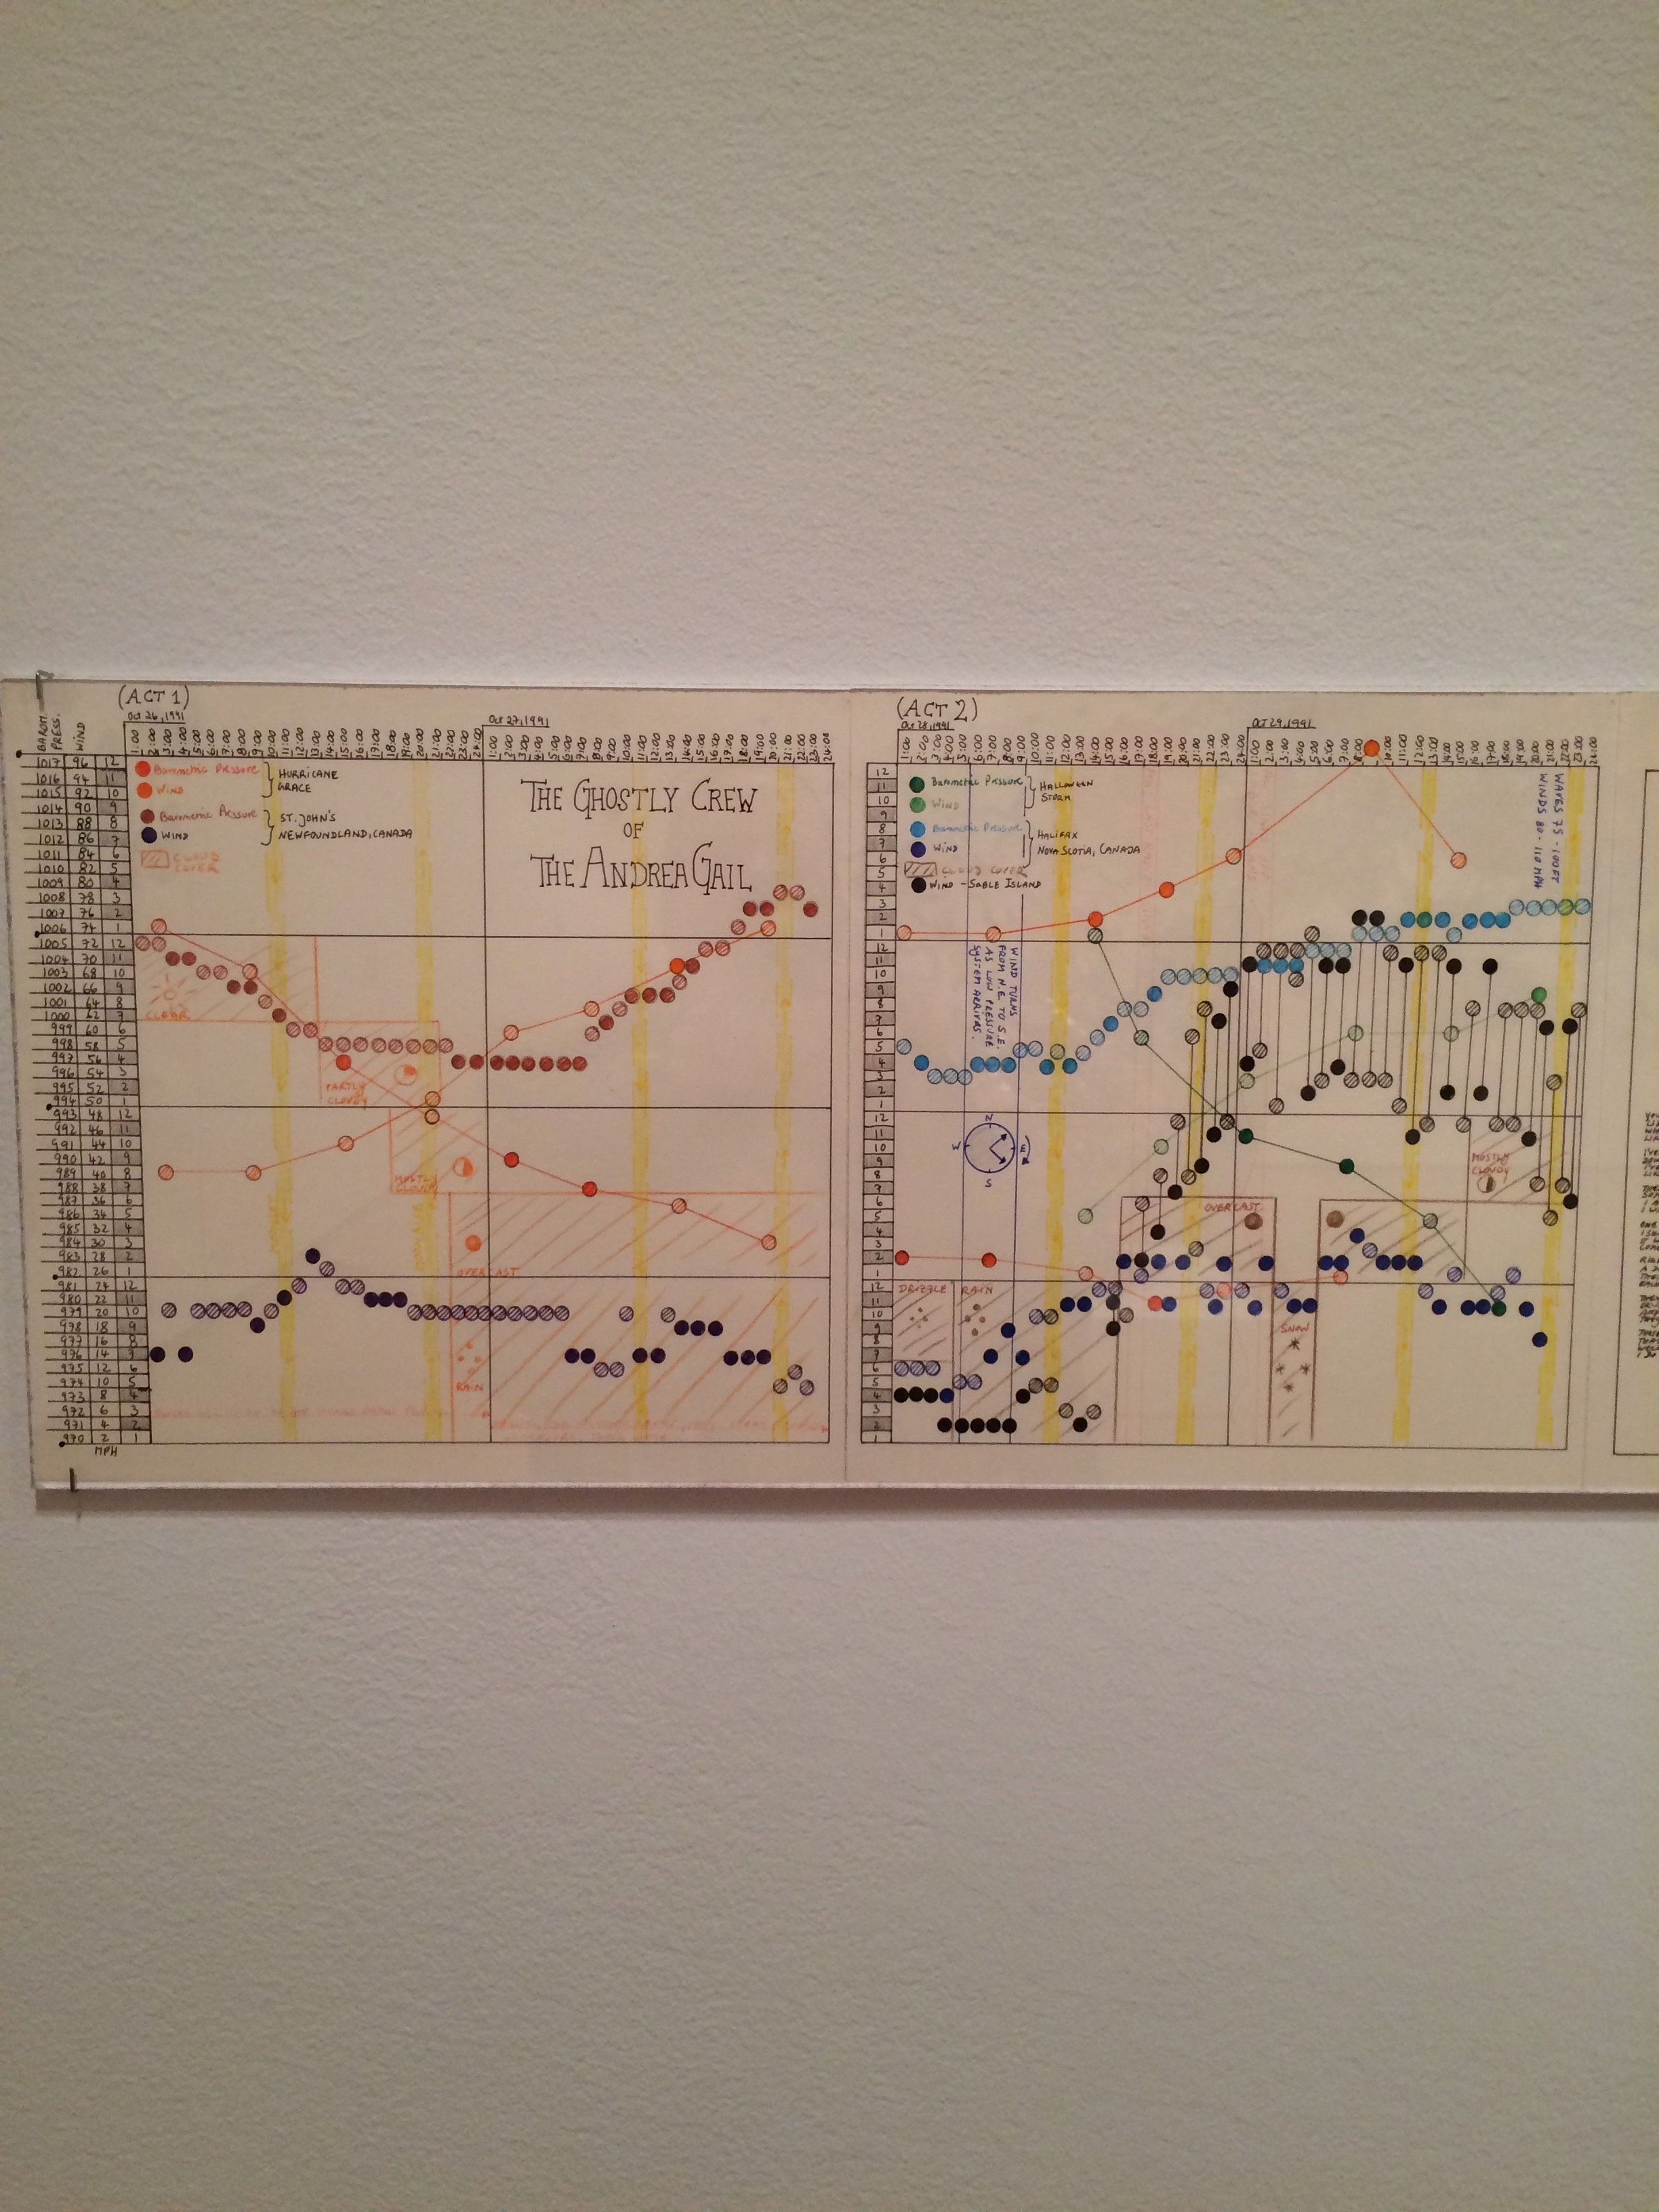
As if Miebach's three dimensional reed grids plotted with colorful data points isn't WOW enough, she also does this amazing thing where she collaborates with musicians to turn weather data into musical composition. She sketches data points into scores. Talented musicians play them on instruments.
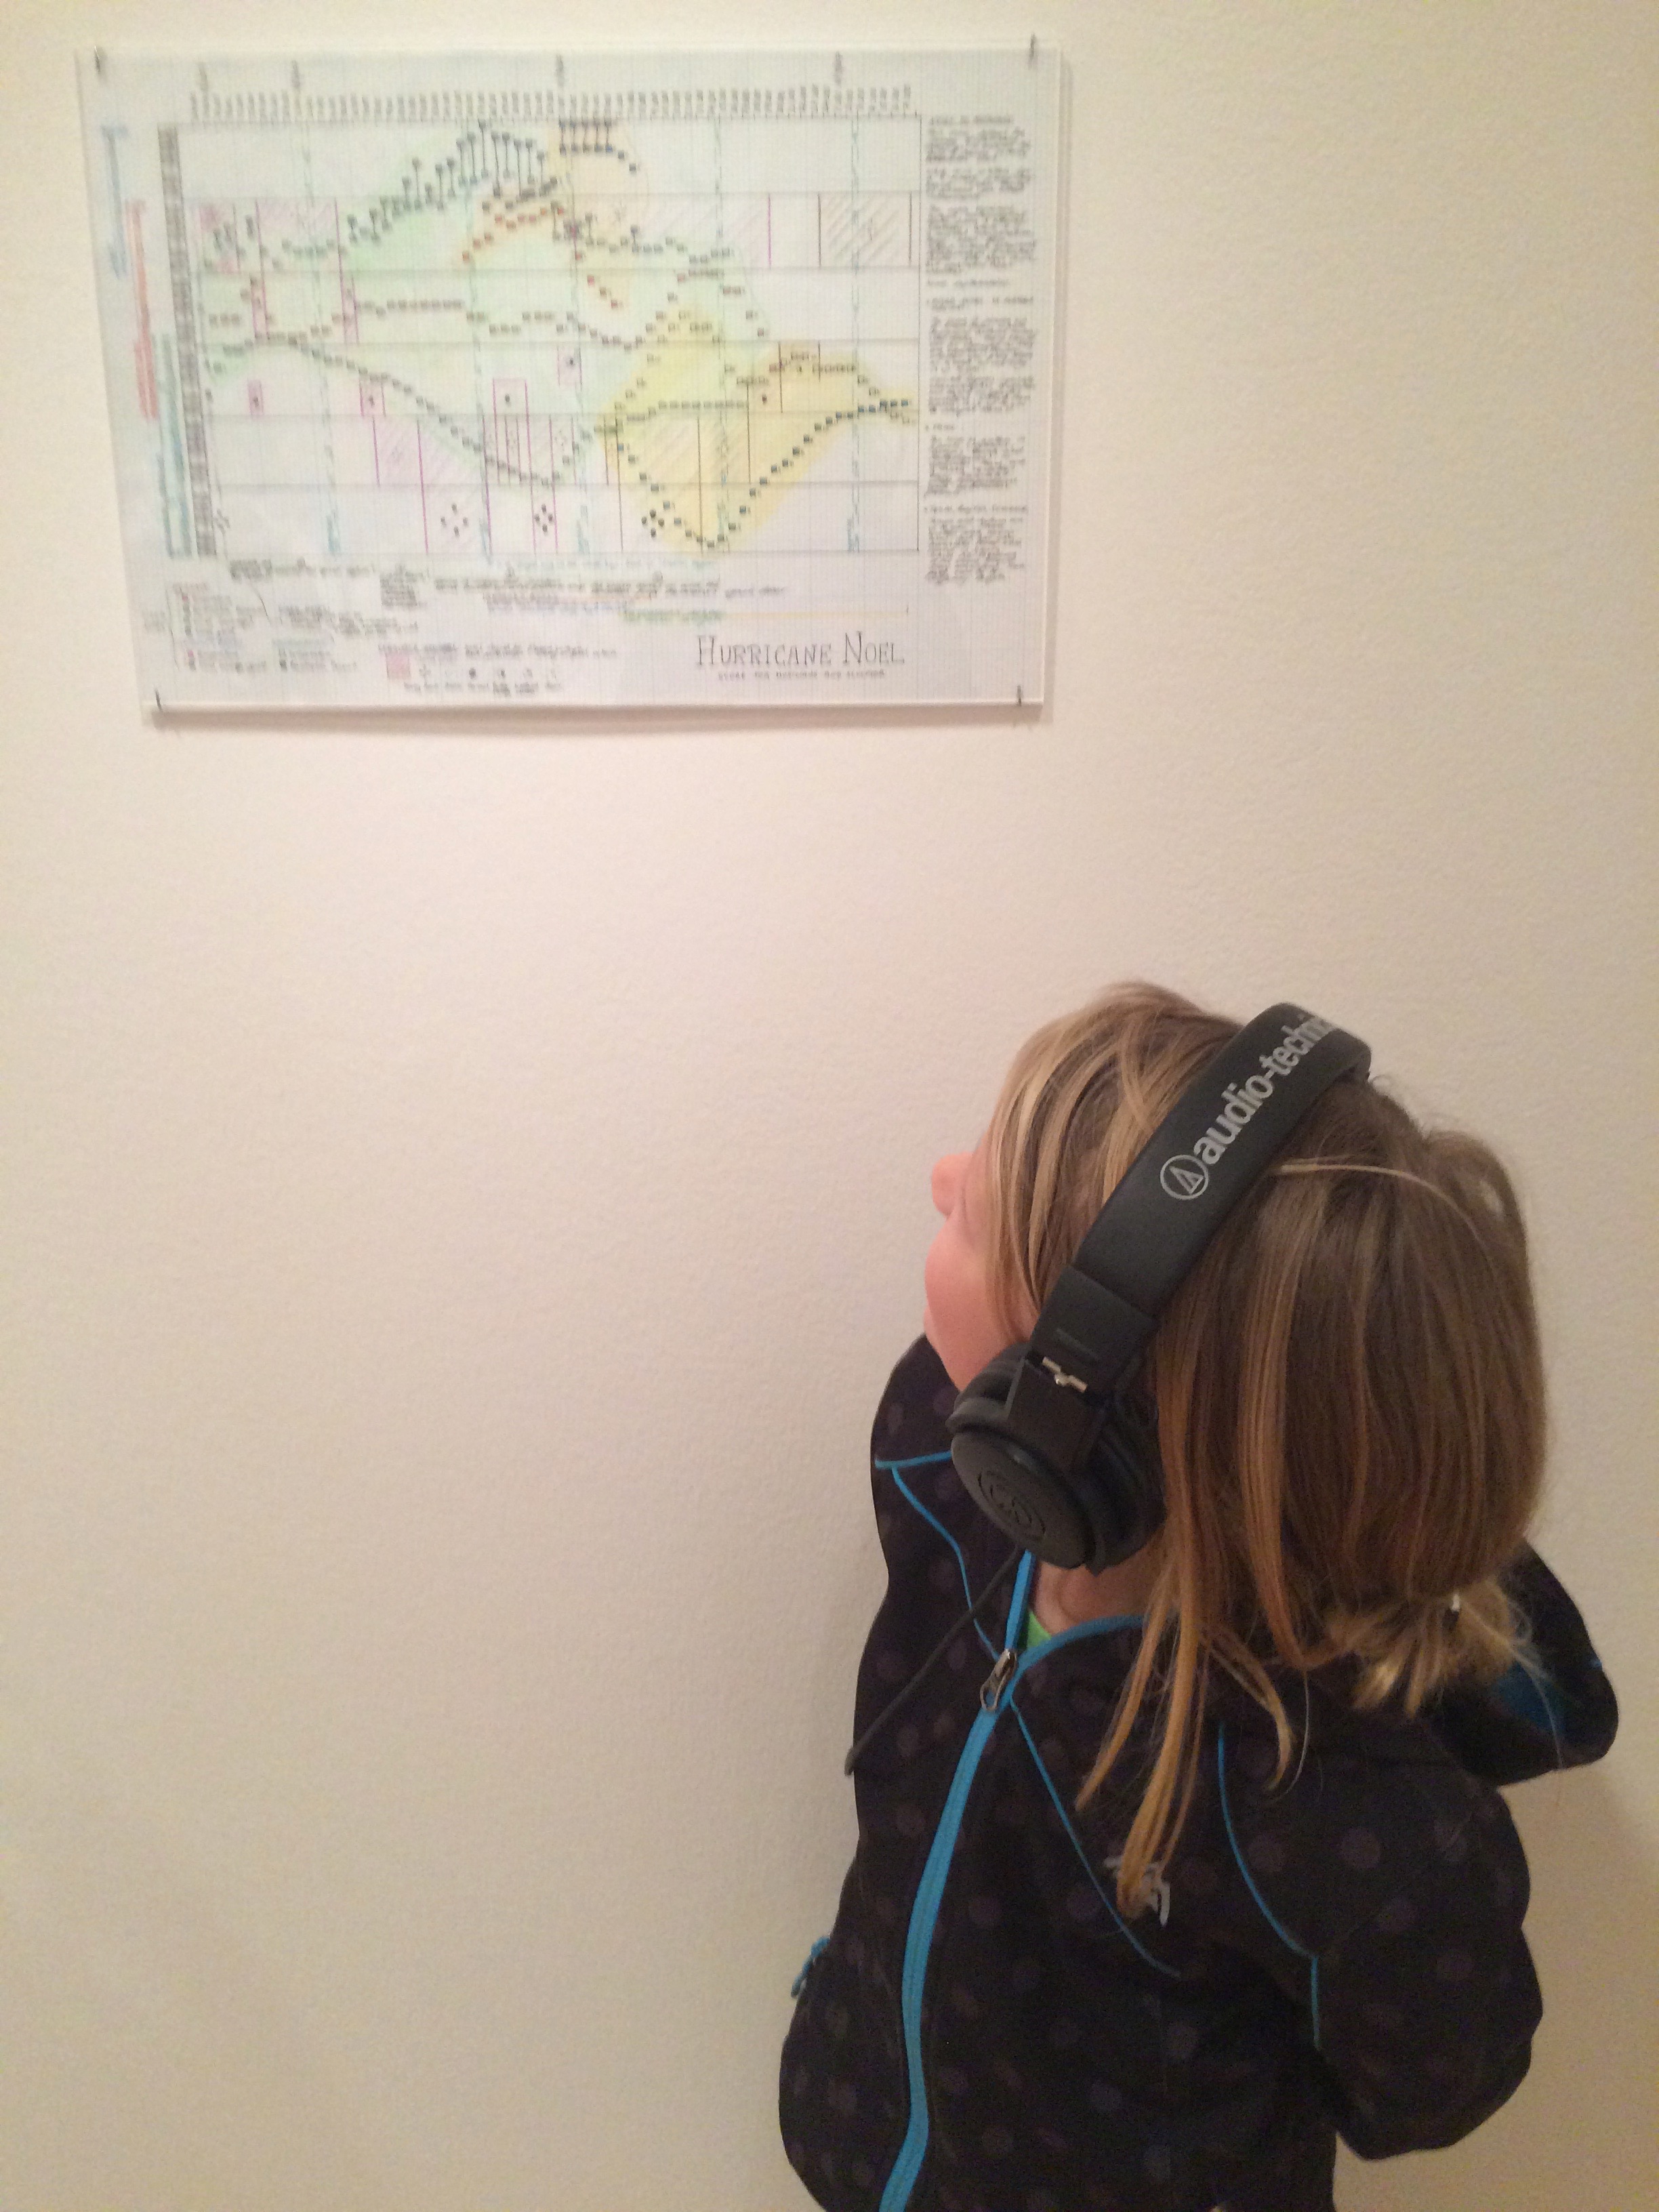
In this interview, Miebach talks about being a tactile learner, why she's attracted to storms, and working with musicians to compose her pieces. You can also check out her TED talk to experience her visual, audible, and tactile data display.
XO.


